Downloads :
| Tools > Financial models |
 Graphical Model for Financial Simulation
of Highway PPP Projects
User guide
Worksheets
The graphical model comprises four worksheets, for which the main functions and outputs of each worksheet are described hereafter.
Data sheet
This sheet summarizes the main characteristics (assumptions) of the PPP project. A few easily identified assumptions can be determined and changed using this sheet. The other key characteristics can be changed directly from the graph sheets.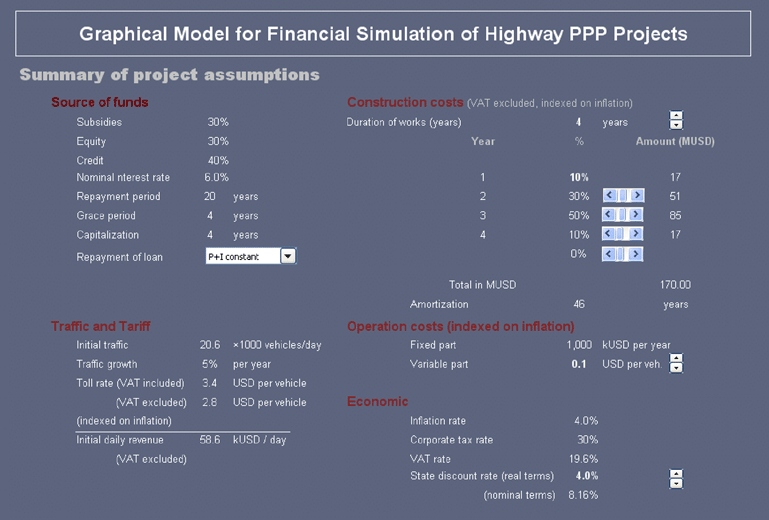
Repayment of loan corresponds to the type of reimbursement of loan. Two types are proposed:
- P+I constant: A constant amount (including Reimbursement of Capital and Interest) is paid at each term
- Linear: The same amount of capital is reimbursed at each term. The interest is calculated from the non reimbursed capital.
Duration of works can vary from 1 to 5 years. The user enters the duration of works and default values for distribution of works are displayed. The user can modify the default values by using the scrolling bars. The percentage of the first year is calculated: 100% - sum (% year 2 to % year 5). If the % of year 1 equals to 0%, it is not possible to increase the % of the other years.
The capitalized items are assumed to be depreciated on a straight line basis throughout the operating period. The datasheet reports the corresponding number of years of depreciation.
The operation costs are paid during the operation period (after the construction period). They are indexed on inflation.
- The fixed part of operation costs covers personnel costs, administration costs, safety and security costs, annual routine maintenance costs of highway and equipment, periodic maintenance costs.
- The variable part of operation costs is linked to the traffic. It corresponds to additional costs due to the growth of traffic (operation personnel, maintenance of tolling station, etc). It is may vary in the range from 0.1 to 5 USD per vehicle.
State discount rate is the rate used to calculate the NPV of government cash flows.
Cash Flow Graph
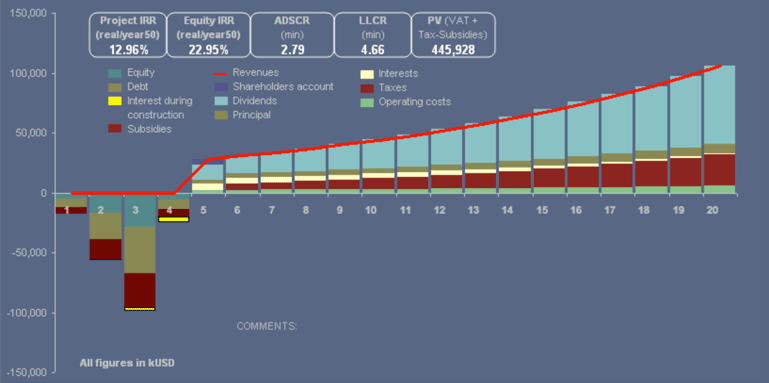
The graph represents all concession company cash flows during the concession period. They are classified by order of repayment priority: Operation costs > Taxes > Debt service > Dividends > Shareholders account.
The shareholder account represents a bank account controlled by the company shareholders (fiscal restrictions generally limit the authorized distribution of dividends to the project net income) to which the cash balance is transferred (or drawn from if negative) until it can be distributed as dividends.
When the shareholders' account is insufficient to service the debt, shareholders have to fill the gap and this appears on the graph in the form of negative dividends.
Debt graph
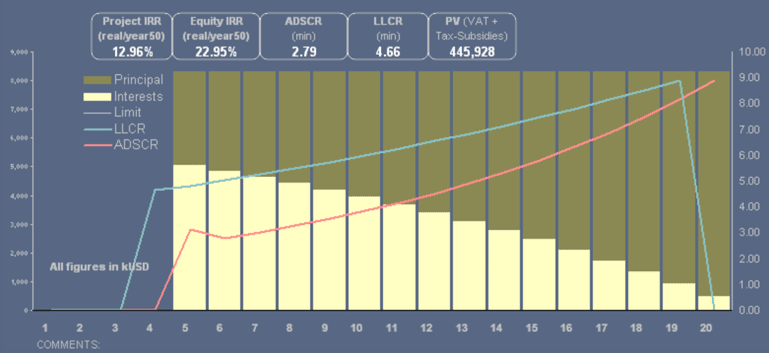
This graph represents, for the first twenty years of the concession period, separately on the LH and RH axes:
- Yearly payment of principal and interest during the debt servicing period (grace period + repayment period)
- Changes in the two main bank ratios over the repayment period: Annual Debt Service Coverage Ratio (ADSCR) and Loan Life Coverage Ratio (LLCR). A definition of both ratios is provided in the Toolkit (Module 2 - Financial Evaluation)
Nominal interest rate is used to calculate the annual interest paid.
Dividend Graph
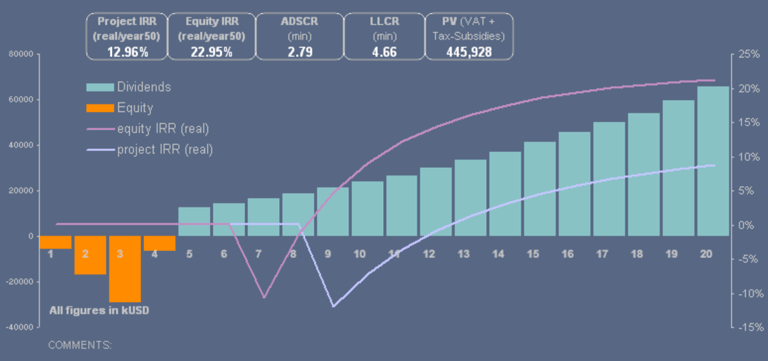
This Graph displays, for the first twenty years of the concession period, on two different axes:
- The equity mobilized by company shareholders during the construction period and the dividends received by them during the operation period.
- Changes in the two main investment ratios over the concession: the financial Internal Rate of Return of the project (Project IRR) and the Equity IRR.
The graphical model allows a rapid verification that Project IRR is independent from financial structure (subsidies, equity, credit conditions) whilst Equity IRR is directly related to it.
Summary of assumptions and results
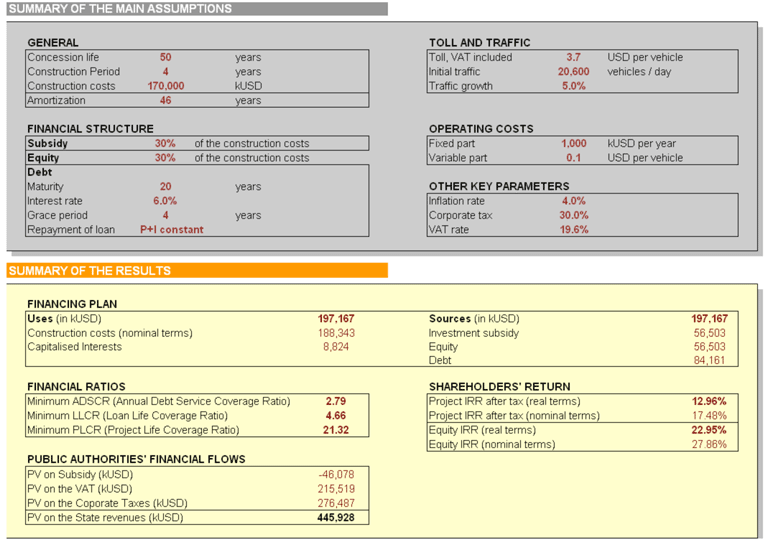
This sheet summarizes the assumptions and results of the project.
Project indicators / ratios

On each of the three graphs, five key project indicators / ratios are displayed.
- Project IRR for the last year of concession in real terms,
- ROE for the last year of concession in real terms,
- Minimum LLCR,
- Minimum ADSCR,
- NPV of net financial contribution from government. The government may pay subsidies during the construction period and recover taxes and VAT during the operation period. The indicator shows the net present value and the financial balance for the government throughout the concession period.
Project data
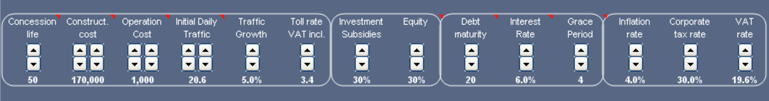
Fourteen key project characteristics can be modified on any of the three graphs which are then automatically adjusted. Ranges of variations have been limited on purpose to realistic values.
Concession duration
Although concession duration can be set at any figure between 7 and 100 years, results are displayed on the graph for the twenty first years only.
Construction cost
The construction cost can vary from USD 5 million to USD 5 billion. This amount represents the total cost over the years of construction period (1 to 5). The incremental steps are adjusted accordingly, varying with the Construction cost. The construction cost excludes VAT, but it is indexed to inflation. The nominal construction cost for the year n will be calculated according to the following formula:
(nominal construction cost)year n = (real construction cost)year n x (1+ inflation rate)n
Two arrow keys can be used:
- the increment of the RH arrow key is 250,000 kUSD,
- the increment of the LH arrow key is 5,000 kUSD
Operation cost
The fixed part of the operation is varying from 1 million USD to 500 million USD per year.
Two scrolling bars can be used:
- the increment of the scroll bar on the right is 10,000 kUSD,
- the increment of the scroll bar on the left is 1,000 kUSD
Initial daily traffic
Initial daily traffic corresponds to the daily traffic of the first year of operation.
Two arrow keys can be used:
- the increment of the arrow key on the right is 2,000 vehicles per day
- the increment of the arrow key on the left is 100 vehicles per day
Traffic growth
Traffic growth is used to estimate the traffic forecasts during the period of the project. It can be increased in increments of 0.5%.
Toll rate
Toll rate corresponds to the average toll paid by vehicles in the first year of operation, including VAT. For subsequent years, the toll rate is adjusted with inflation.
The initial revenue is the amount of revenue generated by the project in the first year of operation. This revenue equals the initial traffic multiplied by the initial toll rate excluding VAT; the operator shall receive the road toll proceeds with VAT and pay the VAT back to the State.
Subsidy rate
Subsidy rates can be adjusted by the user. The amount of debt is calculated by the model to reach 100% of investment cost (Equity + Subsidy + Debt = 100%).
Equity rate
Equity rate can be adjusted by the user. The amount of debt is calculated by the model to reach 100% of investment cost (Equity + Subsidy + Debt = 100%).
Debt maturity
Debt maturity = Grace period + Repayment period of capital. Concession duration must be greater than Debt maturity.
Interest rate
Interest rate is a nominal rate (including inflation). It can vary from 0% to 25%.
Grace period rate
Grace period is the period during which repayment of the principal is deferred. This term does not refer to interest payments. The grace period is adjusted according to the duration of works (construction period): grace period must be above or equal to the duration of works.
Inflation rate
Inflation rate is used to estimate the forecasts of revenues and operating costs, and to calculate the real rates of financial indicators.
Corporate tax rate
Corporate tax corresponds to the corporate tax (profit tax) paid by the concession company. This rate is applied to Earnings before Taxes (Revenues - Operating costs - Amortization - Financial costs).
VAT rate
VAT rate is used to calculate the VAT paid annually to the State by the private partner from project revenues. The Model assumes that no road users can reclaim VAT on tolls.
Summary of project data ranges
The following table describes the lower and upper limits of the 14 project characteristics.
| Data | Minimum | Maximum |
| Concession life | 7 years | 100 years |
| Construction cost | 5 million USD | 5,000 million USD |
| Fixed operation cost | 1 million USD | 500 million USD |
| Initial daily traffic | 0 vehicle per day | 120,000 vehicles per day |
| Traffic growth | 0% | 10% |
| Toll rate | 0.1 USD per vehicle | 100 USD per vehicle |
| Subsidy rate | 0% | 100% |
| Equity rate | 0% | 100% |
| Debt maturity | Grace period + 1 | Concession life |
| Interest rate | 0% | 25% |
| Grace period | Duration of works | 8 years |
| Inflation rate | 0% | 50% |
| Tax rate | 0% | 100% |
| VAT rate | 0% | 100% |
Comments
Comments are triggered by the model to inform of unrealistic or impossible data entries. For example, if the concession period is set at a value less than the sum of the repayment period and the grace period, a message is displayed to alert the user and the model automatically corrects one of the three parameters to ensure their coherence. Similarly the model would also adjust automatically the financial structure to ensure coherence (Equity + Subsidies + Debt = 100%).