| Implementation & Monitoring > Due Diligence and Feasibility Studies |
 Technical Evaluation
Demand Forecasts
Module 3 describes in greater detail the traffic forecasting process. Some further useful information is provided at the implementation stage. Forecasts and scenarios must be developed within a demand analysis that is consistent with the scope of the project (and tariff levels) and fully identifies the sources of demand including the area(s) and population to be served by the project.
Forecasting is partly technical (science) and partly experience and intuition (an art) and can only give a useful indication of future demand. Forecasting over a 20 year period or more is difficult: there will almost certainly be unforeseen internal and external shocks to the economy as well as technological and social change.
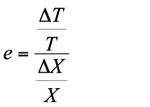
Traffic predictions are usually based on regression analysis i.e. linking past demand growth (the dependent variable) to factors such as GDP growth, population etc. (independent variables). This enables the projections of demand into the future, based on future projections of GDP, population etc. which are more generally available and stable.
The mathematical model mostly used to represent the correlation between traffic and a macro-economic parameter is as follows:
![]()
where, T is the traffic related indicator (dependent variable) e.g. vehicle-kilometers, consumption of fuel, registration of vehicles etc., X is for instance the GDP (independent variable) and K and e are coefficient to be determined to fit the true time series figures. This mathematical model implies that "e" is a constant representing the elasticity of traffic in relation to the macro-economic parameter, e.g. GDP, GDP/capita. That is,
Trend based projections can also be useful where past data is available over reasonably long periods (e.g. 10-15 years), where the data is not too erratic and preferably if the project under consideration can either be related to those roads along which historical/trend based traffic figures are analyzed or national data or both.
Traffic forecasts are commonly the primary basis of the economic and financial analysis and are thus highly important. However, they are required as part of the technical evaluation irrespective of the economic/ financial analysis, as traffic volumes, particularly those of heavy vehicles, are paramount to the pavement design of roads, which in turn impacts on the cost of the road facilities.
In order to distribute traffic demand between existing road(s) and a proposed toll road, it can be useful to employ a traffic assignment model which incorporates a transport network (primarily roads but may also include other modes) in a wider area of influence of the project. A traffic model is useful to simulate and test various configurations of the road network, different toll policies via generalized cost functions as well as the influence of congestion resulting from the use of adapted speed-flow curves.
In the absence of a traffic network model (which may well be too expensive and time consuming except for major individual projects), a more restricted method could be used to estimate the traffic assignment along a proposed toll facility, in relation to the alternative road/s for traffic with common origin and destination. To this end, one may use for example the "rule of Abraham" method which is commonly employed to compute the traffic split between competing routes. More details are given below.
Example of traffic demand assignment for a proposed toll road
| The traffic demand on a proposed toll road focuses on the prediction of traffic split between the existing road/s and the proposed new toll facility. Preferably a traffic model should be employed to this end, as it offers the possibility to include a large area of influence comprising alternative routes and modes of transport. However, in various cases it is useful to carry out a simpler analysis, using for instance one of the methods outlined below. |
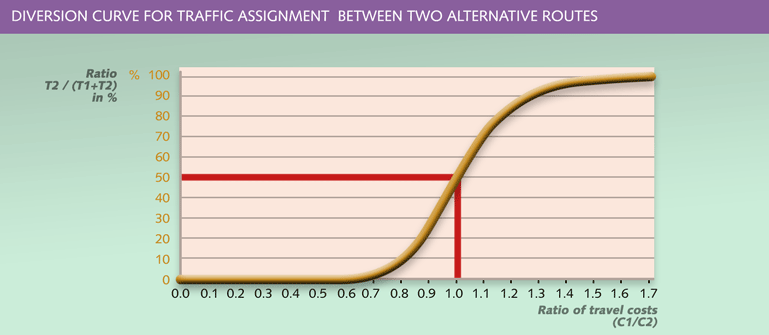
Rule of Abraham method
Traffic splits between two alternative routes according to the following rule:
T1/T2 = (C2/C1)k
Where,
T1: traffic on route 1 (after reassignment)
T2: traffic on route 2 (after reassignment)
C1: generalized cost along route 1
C2: generalized cost along route 2
k: exponent
The above formula can also be written as:
T2/ (T1+T2) = 1/ [1 + C1/C2)-k ]
In France it is common to use an exponent k = 10. The graph below illustrates the rule for k=10. One may notice that in the case where the generalized cost is similar along both alternatives, the traffic is expected to split equally between the two competing routes.
Theoretically the above formula could be extended to n routes having the same route choices:
![]()
Where Ci is the generalized costs on the competing routes, or by way of calculating the percentage of traffic on route i in relation to all competing routes:
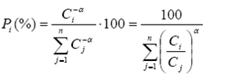
Where Pi is the % on route i, Ci the generalized cost on route i and Cj the total of generalized cost along all competing routes and alpha the equivalent exponent to k as explained above.
Abraham's rule assumes that the perceived advantages of one route in relation to another are distributed according to a "normal" (Gauss) distribution.
If the average generalized costs along two competing routes are C1 and C2 and that along route 2 the traffic is subjected to a toll t, then the formula takes the form of:
T2/ (T1+T2) = 1/ {1 + [(C2 +t)/ C1]k }
Diversion curves
A method used in California (USA) estimates the proportion of traffic using a route (for instance a freeway toll road), according to the following formula:
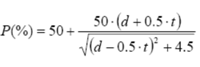
Where,
P (%): percentage of traffic assign to route
d: distance saving using the selected route (in miles)
t: time saving using the selected route (in minutes)
However, it should be noted that a traffic assignment based on the absolute values of saving in distance and time has its drawbacks. For example, it cannot be conceivable that that a saving of, say, 2 min in relation to a total trip length of 10 minutes has the same affect as on a trip length of 1 hour.
Forecasts must reflect both optimism and realism. The experience of previous but similar projects should be incorporated where possible and occasionally experience elsewhere in the world may be relevant. In 2002 an ex post study of 32 toll roads around the world, compared traffic projections against actual first year traffic.
Studies commissioned by Development Banks/IFI (presumably a mix of different agencies as they were not named) sponsored forecasts whose projections averaged only 82% of actual, while studies commissioned by others, including project sponsors, averaged only 66% of actual.
The study noted that if there was a small difference between actual traffic and projected traffic in the first year, actual traffic quickly caught up with, and often overtook the forecast. Where there was a large initial difference, traffic was slow to catch up and often never did. The study concluded that forecasting errors were not random and there was systematic optimism bias, with IFI commissioned forecasts being relatively more accurate than those being commissioned by sponsors. This may be due to sponsors who may have imparted too much optimism to their consultants, and/or spent less on their traffic studies or who may have considered renegotiation a good possibility after contract signing.
![]() Credit Implications of Traffic Risk in Start up Toll Facilities, Standard and Poor's, 2002.
Credit Implications of Traffic Risk in Start up Toll Facilities, Standard and Poor's, 2002.
Given the necessity and importance of forecasting but its inherent weaknesses, scenarios should be developed to provide (i) low, (ii) high and (iii) most likely/best guess levels of demand. Initial scenario development at a more strategic level (GDP, Regional Development etc.) can be useful in assessing the impact on design, timing and cost.
It can also be useful to assess the broad impact on the EIRR and NPV. More detailed sensitivity and risk analysis can be undertaken related to this selected specific scenario, rather than all strategic scenarios. This is undertaken by varying individual parameters such as demand, capital cost and is described in section 3 which follows below.
Demand forecasts must also include the design capacity i.e. demand forecasts used in the project analysis must not exceed the proposed design capacity and, for all projects, the projected demand must be consistent with the proposed tariff or tariff scenarios.
Tariffs must also at the same time reflect Willingness to Pay (WTP) and Ability to Pay (ATP). Willingness to pay reflects the amount an individual or company is willing to pay to acquire some good or service. Ability to pay reflects payment based on capacity to pay. Survey techniques include Stated Preference (response to hypothetical survey questions) and Revealed Preference (Drawing conclusions from surveys of actual behavior). There should therefore be both WTP and ATP analysis.
The former can be a relatively simple exercise where there are limited numbers of users. For toll roads and public passenger transport, ability to pay is also an important consideration and may require more extensive surveys than other sectors. The potential problem for PPP projects is where ATP is below the cost recovery level and subsidy/support must be considered if the project is to be implemented.
Engineering/Technical Aspects
The study must also include technical description and plan of the project that identifies all relevant engineering and non-engineering components. This will conclude with a preliminary design, including technical specifications/location and preliminary layout plans/alignment etc. This would include capacity and performance standards. It would contain the proposed standard of project outputs and facilities and outputs, etc. which would provide the basis of the minimum technical requirements to be provided within the RFP.
While full geotechnical, hydrological, structural, drainage and other technical studies are not required at this stage, sufficient technical and survey work must be undertaken to be able to cost the project (including alternatives) to within say ± 20%. The preliminary cost estimate must also be accompanied by an implementation program reflecting the timing and interrelationships of all of the major components of the project.
The technical specification must conform to the least cost solution to meet the projected demand (phased if necessary) and other objectives.
Technology
The study should also consider any benefits that may be gained from the use of new technology, including e-commerce, improved management systems and higher levels of skills. It should also identify any possible technological threats.
![]()
![]()